What if housing valuations are in a structural, multi-decade decline?
A strong case can be made that the fundamental supports of the housing market-- demographics, employment, creditworthiness and income--will not recover for a generation. It can even be argued that housing has lost its status as the foundation of middle class wealth, not for a generation, but for the long term.
Let's begin by noting that despite the many tax breaks lavished on housing--the mortgage interest deduction, etc.--there is nothing magical about housing as an asset. That is, its price responds in an open, transparent market to supply and demand and the cost of money and risk.
There are a number of quantifiable inputs that feed into supply and demand--new housing starts, mortgage rates and income, to name three--but there are other less quantifiable inputs as well, notably the belief (or faith) that housing will return to being a "good investment," i.e. rising in price roughly 1% above the rate of inflation.
If this faith erodes, then the other factors of demand face an insurmountable headwind, for the most fundamental support of housing is the belief that buying a house is the first step to securing middle class wealth.
Rising rates of homeownership require five conditions:
1. Favorable demographics: a cohort of potential buyers that is larger than the cohort of potential sellers.
2. Rising household formation rates: an expanding population does not necessarily translate into rising rates of household formation. If the number of people per household goes up, then the number of households can plummet even as population expands.
3. A large cohort of creditworthy potential buyers: that means buyers with savings, buyers with sufficient income to pay the mortgage and buyers with low debt loads.
4. An economy that generates rising incomes to support homeownership.
5. An unshakable belief that owning a house is a favorable and secure investment that will rise in value in the decades ahead.
If the first four conditions have eroded, then the belief in the permanence of a rising housing market will also erode.
The demographics are not favorable to housing on a number of fronts. Jim Quinn recently posted some devastating charts of U.S. demographics in his brilliant post CAUSE, EFFECT & THE FALLACY OF A RETURN TO NORMALCY (The Burning Platform).
Without going into too much detail, we can stipulate that the Baby Boom (65 million people) will be downsizing their housing, i.e. selling for the next two decades. We can also stipulate that most of the Baby Boom no longer has the wherewithal to buy second homes; rather, they will be dumping second homes to pay for living expenses as earnings, interest income and housing equity have all cratered since 2007.
Not only are there not enough younger workers to buy all these millions of homes that will be put on the market, few of those younger workers have either the creditworthiness or income to buy a house unless the Federal government gives them essentially free money and a no-down payment entry. With the Federal deficit skyrocketing, that sort of giveaway won't last long.
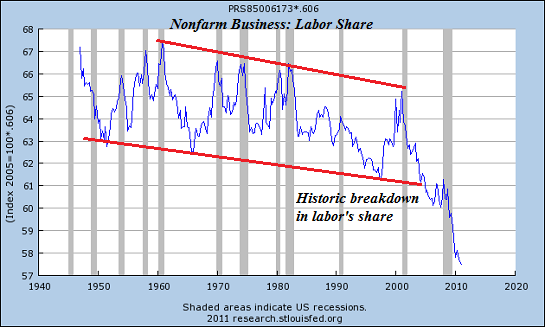
Labor's share of the national income has plummeted to historic lows. How can households be expected to buy a house when their real (inflation-adjusted) income declines year after year?
Labor share is the portion of output that employers spend on labor costs (wages, salaries, and benefits) valued in each year’s prices. Nonlabor share—the remaining portion of output-- includes returns to capital, such as profits, net interest, depreciation, and indirect taxes.

source: The Big Picture/ritholtz.com
This chart suggests that a fundamental structural shift has taken place since the dot-com bubble popped in 2000: labor's share of the national income is in a secular long-term decline. That does not bode well for household income going forward.
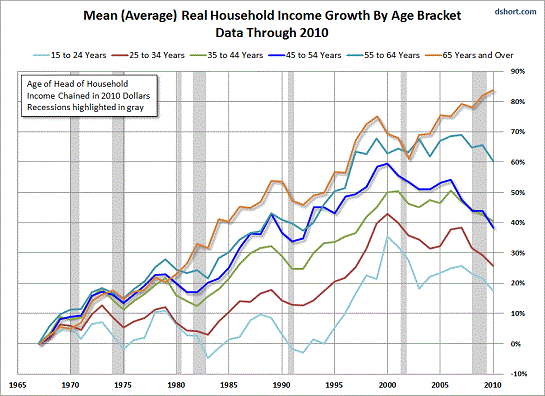
Meanwhile, income has declined, especially for younger workers. Soaring Poverty Casts Spotlight on ‘Lost Decade’:
According to the Census figures, the median annual income for a male full-time, year-round worker in 2010 — $47,715 — was virtually unchanged, in 2010 dollars, from its level in 1973, when it was $49,065. Overall, median household income adjusted for inflation declined by 2.3 percent in 2010 from the previous year, to $49,445. That was 7 percent less than the peak of $53,252 in 1999.

Notice that the only age brackets with flat or rising incomes are the over 55 cohort; everyone younger than 55 has seen their income slashed. And this is assuming "official" inflation is accurate; if it understates real inflation (loss of purchasing power), then the income declines are actually much more severe than charted here.
read rest of article here
No comments:
Post a Comment